The Values drop zone drives the quantitative data in the query. The Values zone is where values (measures) being added to the query should be placed. The behavior of the Values zone differs according to the visualization type selected.
Adding Values to Grids
When working with grids, the Values zone works in conjunction with the Columns and Rows zones.
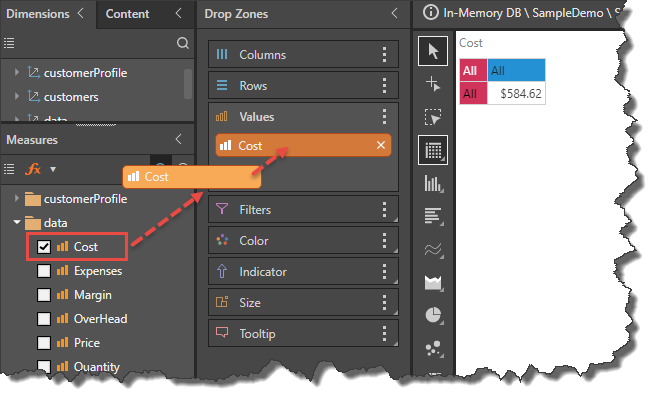
A measure may be added to the Values zone by:
- Dragging and dropping it into the Values zone.
- Selecting the measure's check box.
- Double clicking on the measure.
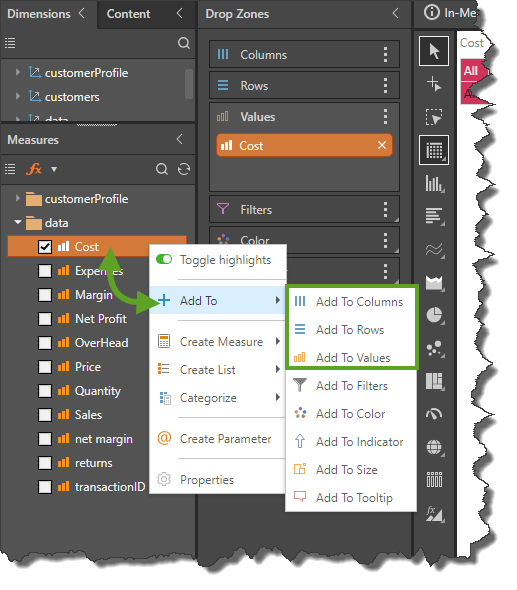
- Right clicking on the measure and selecting Values from the context menu (see image below).
Values Chip
An orange Values chip is automatically generated when a measure is added to Columns or Rows, or when more than one measure is added to the query. The Measure chips will remain in the Values zone, while the Values chip can be placed wherever required. The placement of Values chip in the drop zones then drives the location of the measure(s) in the visualization.
Multiple Measures
When working with grids, if more than one measure is added to the query, a Values chip will be generated and added to Columns. The Values chip determines the location of the measures in the grid.

In this example, the Values chip was moved from Columns (image above) to Rows (image below):

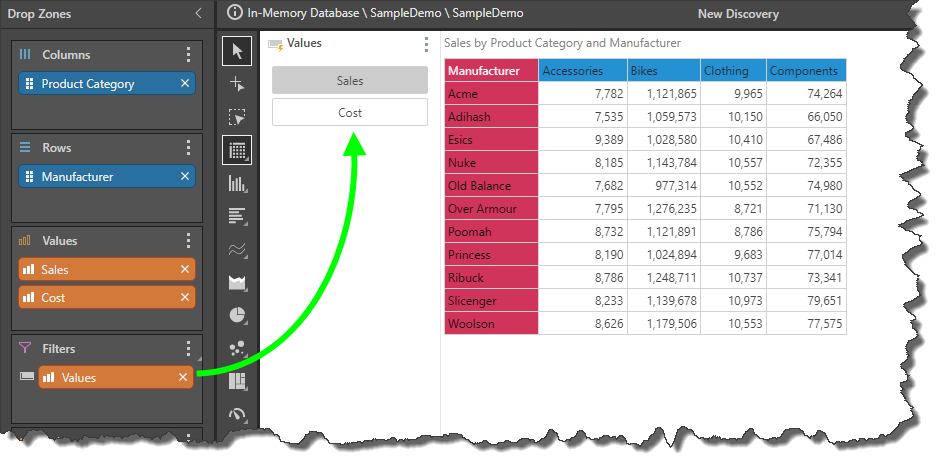
The Values chip can also be moved to the Filters zone to generate a slicer from which the required measure can be selected:
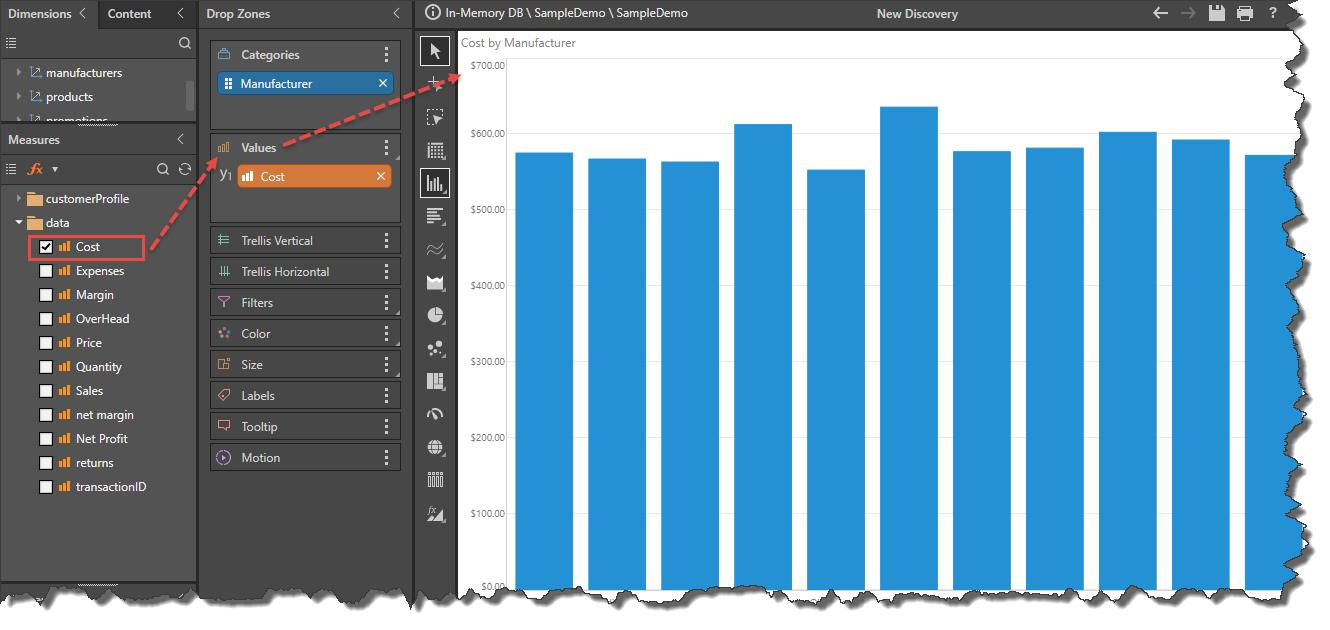
Adding Values to Charts
When working with charts (excluding scatter and map charts), at least 1 measure must be added to the Values drop zone; this measure will be used for the chart's y-axis, and (depending on the chart type) will drive the size, height, or length of the chart's segments.
Values Chip
If the measure chip is moved to one of the Trellis zones, or to the Filters zone, a Values chip is automatically generated. The Values chip is also generated if more than one measure is added to the Values zone.
The given measures will remain in the Values zone, while the Values chip can be placed wherever required. The placement of the Values chip drives the location of the measures in the chart.
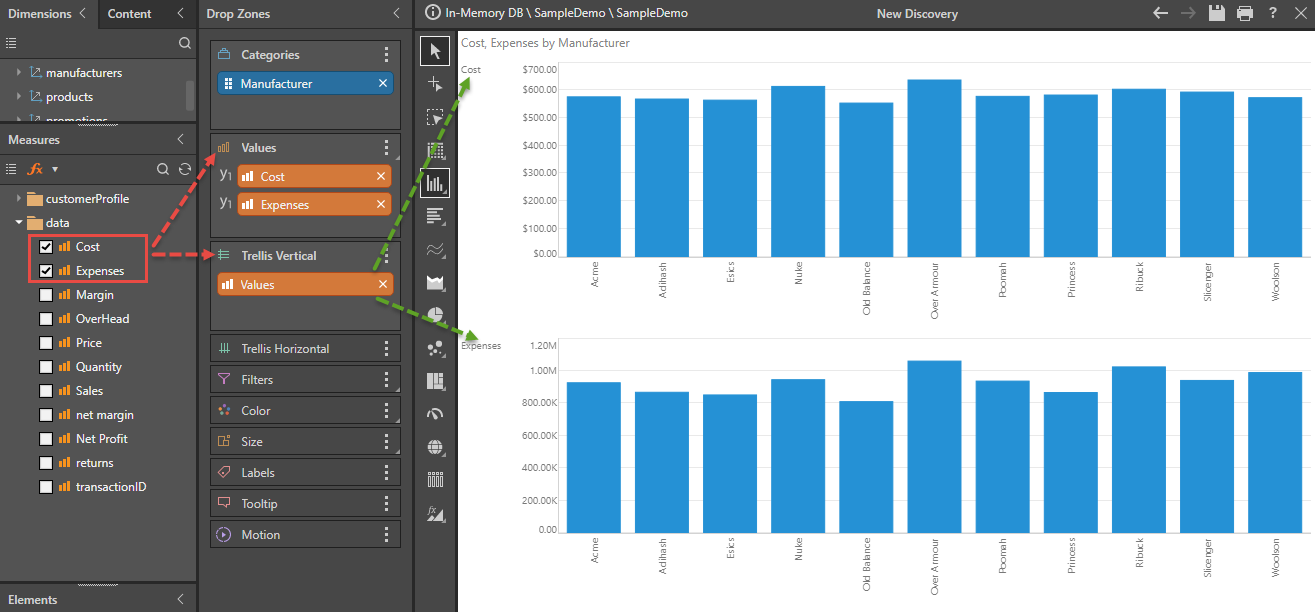
Multiple Measures
If more than one measure is added to Values, and Values chip will be generated and added to Trellis Vertical, resulting in multiple charts. The Values chip may be moved to Trellis Horizontal or Filters.
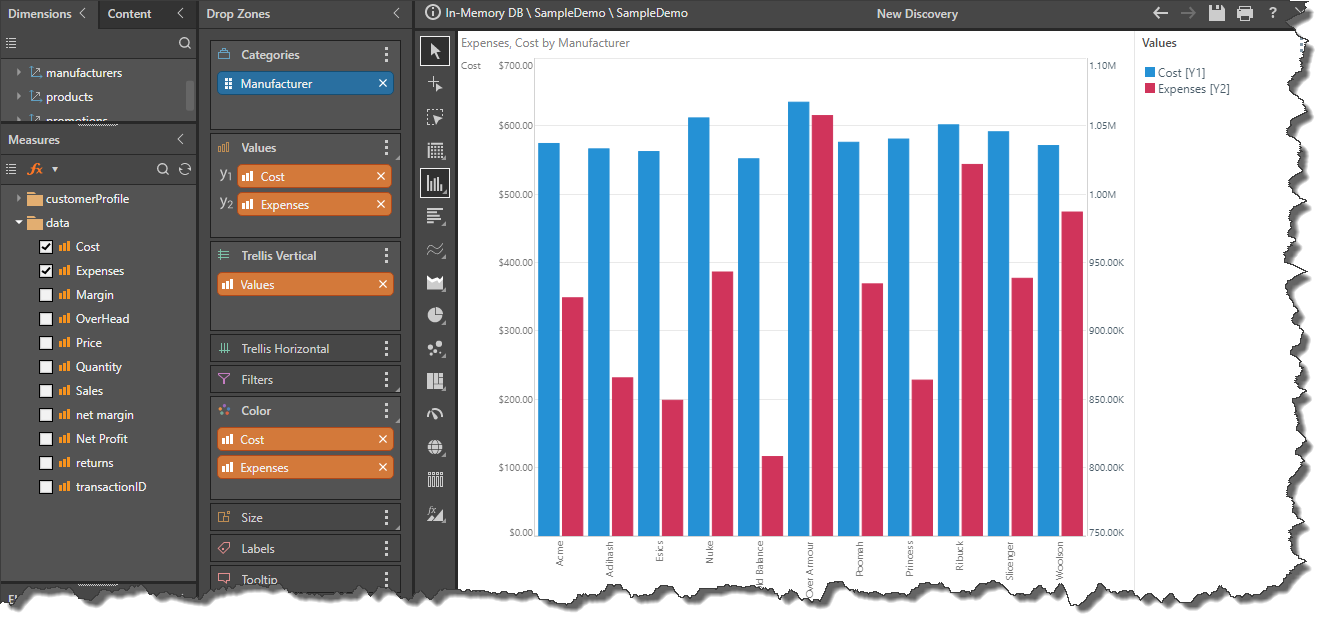
Combo Chart
However, a second measure may be added to the chart's secondary axis to create a combo chart, displaying 2 measures in a single chart.
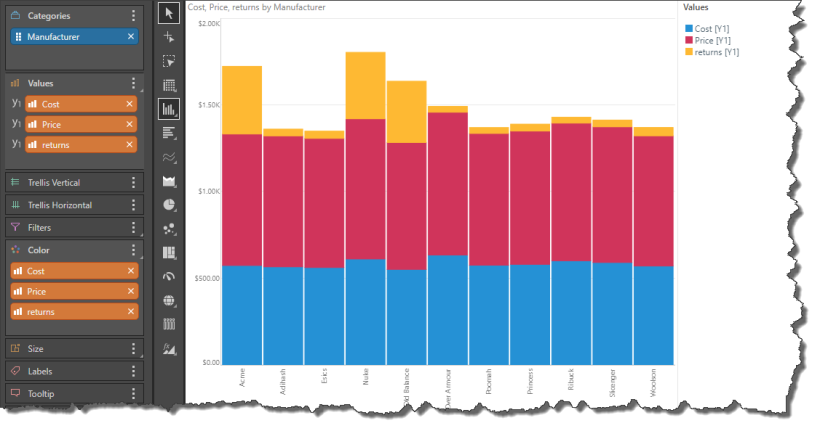
Stacked Measures
When working stacked charts (stacked column chart, stacked 100 column chart, stacked area chart, or stacked 100 area chart), you may add multiple measures to the primary axis to build a stacked measure chart.

All given measures will be listed in both the Values and Color drop zones, and the resulting chart will display the given measures in a stacked format: